A week before the blizzard of 2022 hit northern and western New York, weather forecasters were eyeing the troubling system developing on the West Coast, confidently predicting it would become a significant snow event when it arrived here.
As it tracked east, confidence only grew that it would be a historic storm.
On Tuesday, Dec. 20, an alert reached the newsroom of the Watertown Daily Times, causing buzz, that the “incredibly powerful” storm described by meteorologists as a “once-in-a-generation type of event” would move through the area over the Christmas holiday weekend.
A day later, the National Oceanic and Atmospheric Administration issued a news release on the storm.
“The combination of snow and wind is likely to lead to blizzard conditions in some areas, making travel dangerous, and at times, impossible,” it said. “Rapid and significant temperature decreases associated with this system raises the potential for the flash freezing of bridges and roadways. The intensity of the cold would pose a significant danger to anyone who becomes stranded in blizzard conditions.”
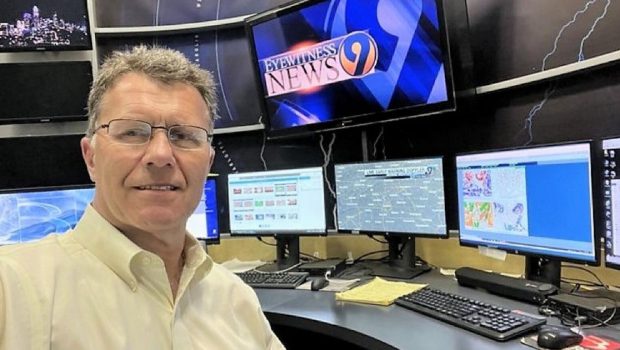
Among forecasters who saw the storm coming days in advance was John Kubis, chief weathercaster at WWNY-TV, 7 News. He recalled walking into the office of Jeffery L. Cole, “7News This Evening” anchor and news director, about 12 days before the storm and saying, “This one is going to hurt.”
“I’ve been in the weather business for 30 years, and that was the easiest storm I have ever forecasted,” he said. “All the models were hinting at it.”
Many people, who either ignored the warnings or who were perhaps hoping for super powers, became stranded in the blizzard, straining first responders. Those who were unprepared couldn’t complain that they didn’t see it coming or have the opportunity to see it on the horizon days ahead of time.
Compare that situation to the Great Ice Storm of 1998, which this month marks its 25th anniversary. Many couldn’t help but not see that storm coming. Since then, forecasting technology has vastly improved.
“The amount of change is unbelievable,” said David A. Zaff, science and operations officer at the Buffalo office of the National Weather Service.
Mr. Zaff, who has been with the NWS since 1995, added, “The amount of data is incomparable to what we had back in 1998.”
Improvements are largely linked to satellite observations and meteorologists incorporating data into weather models.
“What we had in 1998 were some good satellites,” Mr. Zaff said. “They were good for their time, but it’s just like the pixels that you have in a camera. What you had in 1998 pales in comparison to what you can have now.”
He added, “We have satellite observational data 24 hours a day on both sides of the country, east and west. We’ve got access to global data that we didn’t quite have back then as reliably as we do now.”
Comparatively late warnings
There were some warnings received by north country residents in 1998 about icy weather approaching, but it involved a matter of hours, not days in advance. The Buffalo NWS office forecast area includes Jefferson and Lewis counties. The NWS Burlington, Vermont, office issues forecasts for St. Lawrence County.
At 3:07 a.m., Sunday, Jan. 4, 1998, the Buffalo NWS issued this advisory: “A mix of sleet and freezing rain is expected across the region this afternoon and tonight creating very slippery conditions.”
As the event unfolded, at 10:35 p.m. on Tuesday, Jan. 6, the office issued a watch for the main or most impactful portion of the event:
“The National Weather Service has issued a winter storm watch for Jefferson and Lewis counties for the potential of significant ice accumulation from freezing rain Wednesday night and Thursday … a very shallow layer of cold air that has produced occasional freezing rain during the past few days across northern Jefferson and extreme northern Lewis counties will remain entrenched across this same region during the next 48 hours.”
Still, there was just “the potential,” which may have eased some nerves.
But at 3:34 p.m. on Wednesday, Jan. 7, a weather warning was issued, with the word “ice storm” surfacing. By the end of the day, the north country had gone dark.
“The rain will fall through the colder air and freeze up on any untreated surfaces producing a hazardous coating of ice,” the warning stated. “This will be especially true in the low lying areas of the Black River Valley where the coldest air will pool. Because these conditions are expected to last throughout tonight and Thursday there could be areas of significant ice accumulations on trees, power lines and other untreated surfaces from the ice storm. People should be prepared for potential power outages tonight and Thursday. Do not approach downed power lines and stay away from ice-laden trees.”
On Jan. 7, 1998, a meteorologist with the NWS in Burlington told the Times that he expected “a very serious situation” would develop starting that afternoon in St. Lawrence County and continue until at least midday Thursday.
More lead time
“Back then, we typically didn’t issue a warning until we were within a day of the event,” Mr. Zaff said. “It was quite rare to issue a warning a day or day-plus out, mainly because we didn’t have the skill to do so. While we hope an ice storm of that magnitude doesn’t happen again, I expect that if something like that is ever forecast, we’ll be able to provide far more lead time.”
That lead time is due to improved technology on the ground, orbiting Earth and the people who manage it.
As more weather data is received by the NWS, the information is fed to computers with ever-increasing power.
“The amount of data is incomparable to what we had back in 1998,” Mr. Zaff said. “The computer capacity and capability to ingest the increased amount of data allows us to have much higher resolution model data and more accurate forecasts.”
Mr. Kubis, who grew up on a dairy farm near Evans Mills, spent eight years in the U.S. Air Force, beginning in 1989. In the Air Force, he did operational forecasting for pilots in the airfields he was stationed at — from Texas, Oklahoma City, Saudi Arabia and Seoul, South Korea.
“When I first got into the weather business back in the late ’80s after high school, everything was on paper, literally,” Mr. Kubis said. “Tearing and filing was most of my day.”
Most of the data, he said, was on maps.
“It was kind of neat because you’d walk into a weather center back then, and there’d be a huge wall, and the wall would have maps on it,” he said.
He said there was one forecast model in his early days of forecasting — the Nested Grid Model, a numerical predictor based on two levels of grids.
“I think it went out 48 hours, maybe three days,” Mr. Kubis said. “We had another weather model that was all numerical data and you had to know what the numbers meant, so to speak. It was like computer code.”
Even into the 1990s, Mr. Kubis recalls only one computer model for forecasting. Now, there are several, and Mr. Kubis listed various names of some of them in a flurry of data. For example, there’s the European Model, which he calls highly accurate and the Canadian Model, which he said is especially good at predicting lake-effect snow.
‘Better, faster’
Wayne Mahar is president of Precision Weather Service, with offices in Syracuse and Portland, Maine. Mr. Mahar, a Maine native, founded the company in the mid-1970s and began his television career in meteorology in 1978. He came to the Syracuse television market in 1985 and retired in December of 2021 from WSTM-TV after 36 years with the station. Precision Weather Service provides detailed weather forecasts for clients worldwide.
“When I started, you hardly had any computer models,” Mr. Mahar recalled in a phone interview. “The computer models have not only become better and faster, but there’s more of them over the past 20, 30 years.”
Mr. Mahar recalled those models predicting “The 1993 Storm of the Century.” It struck the gulf coast of Florida late on Friday March 12, 1993, and continued slamming Florida and states to the north on Saturday. To residents in some states farther north, the storm was dubbed “The Blizzard of the Century,” although northern New York residents took the storm in stride, as its effects here appeared muted. Syracuse received about 3 feet of snow from the storm.
A weather observer at Massena Airport summed up the 1993 storm as little more than a late winter snowfall. In Watertown, the storm dropped 20 inches of snow.
However, the NWS said that it was a blizzard like few had seen before, dropping temperatures, dumping snow, breaking trees and knocking out power over a wide swath from Alabama and Georgia to Maine.
Mr. Mahar recalled that “The 1993 Storm of the Century,” like last month’s blizzard, was forecast about a week out, which was highly unusual for the time.
“Back then in 1993, to say that you saw something like that a week in advance, it’s probably bordering on incredible,” Mr. Mahar said.
In March 1993, Paul Greavez, a meteorologist with the NWS in Albany told the Times that the storm was easy to predict because it was so huge.
“It was like seeing a freight train come at you. It was pretty hard to miss,” he said.
But the human element is also key in forecasting, Mr. Mahar said.
“Even an experienced meteorologist is going to question, ‘Is this really something to be concerned with or is this just the computer model that’s going a little berserk?’” Mr. Mahar said. “So then you start watching the trends, and back then for the Blizzard of ’93, computer models continued to show it on every computer run, a major storm developing, just about the same sort of track, and where it was going to go. It was extremely well forecast.”
In 1998, weather forecasters saw two troubling systems about to collide as the ice storm developed.
“There aren’t too many places in the U.S. that you’re going to get that perfect setup, where you’ve got enough cold air and then it stops at a certain spot, stays there for two or three days, while moisture continues to come in from the south,” Mr. Mahar said. “That weather setup isn’t going to happen in very many places.”
He explained the unusual setup: “You had the cold front that had cold air behind it coming down from Canada, and basically stalling across the Thousand Islands, Watertown and over to Old Forge.”
“The cold front stalls there with temperatures below freezing. And then you had incredible amounts of warm, moist air coming in from the south and the pressure pattern was set up just right so the front and the cold air did stall. The amount of moisture coming in from the south was persistent for two or three days, which allowed ice to build up to 3 or 4 inches.”
Mr. Mahar added, “Basically what happened in the ice storm of ’98 is that you had computer models that latched onto this weather scenario and wasn’t going to let go of it, and as hard to believe as 44 inches of snow in Syracuse was to the Blizzard of ’93, or 3 or 4 inches of ice for the ice storm, if you consistently see that from a variety of models, then you’ve got to have some belief that this could very well happen. But you try to temper that a little bit with what’s within the realm of reality. It’s like a baseball pitcher throwing a no-hitter. It happens, but it normally doesn’t happen.”
Such unusual weather patterns also played a factor in October 2012, when Super Storm Sandy slammed East Coast states, causing devastation. The storm was the remnants of Hurricane Sandy. Sandy transitioned into a post-tropical cyclone just prior to making landfall near Atlantic City, New Jersey, on the evening of Oct. 29, 2012. A NOAA forecaster predicted a historic “Frankenstorm” — a combination of high wind, heavy rain, extreme tides and snow.
“Super Storm Sandy took a track that was highly unusual,” Mr. Mahar said. “It was tracked moving up off the East Coast, and then a couple hundred miles east off the New Jersey shore, stalling and moving directly west into northern New Jersey and pummeling New York City and Long Island. The reason it caught a lot of meteorologists off guard as far as the intensity or how bad it was going to be, is because very few meteorologists believed it was going to do that as a track, because that was highly unusual. You’re forcing yourself to say that, ‘This is just so far out of the realm of normal, I don’t believe it.’”
Mr. Kubis, recalling the track of Hurricane Sandy, said the European Model was highly accurate in its forecast as the storm crept up the East Coast.
“It was the only model that had it hitting New Jersey,” he said. “We’re talking like seven or eight days out. It never changed, and everybody thought it was going to go out to sea.”
More models, more confidence
The National Weather Service is a part of the National Oceanic and Atmospheric Administration branch of the Department of Commerce.
“What comes out of your tax dollars are some of the most expensive and productive forecast models in the world,” Mr. Zaff said. “They’re never perfect. That’s why they’re forecasts. But what we could do in 1998 pales in comparison to what we can do today.”
According to the NWS, the history of using mathematical models to forecast weather and water can be traced back to the early 20th century but only became useful with the advent of computers.
In 1998, Mr. Zaff said the NWS only had “essentially, one or two” weather computer models.
“They were updated once every 12 hours and gave you a coarse idea of what was going to happen,” Mr. Zaff said. “Today, we have dozens of computer models. They’re all producing generally the same idea, that gives us more confidence. If we have a dozen different computer models telling us a dozen different things, we’re going to have a no-confidence forecast. But if we have a dozen computer models and if we have 11 out of 12 saying, ‘Hey — it’s going to snow.’ That’s going to give us a lot of confidence.”
Mr. Zaff said computer models also have the ability to incorporate past weather as a forecast is created.
“Effectively, we have artificial intelligence looking back at past events and saying, ‘Based off this past event, the current forecast models are probably a little too warm or too cold or too snowy or not snowy enough,’ and they create some biases that improve the forecasts,” he said. “That allows us to compare and contrast some of these past events to our current forecasts and to make adjustments. There’s always a human involved in the end-stage output.”
Mr. Kubis used past data to predict that December’s blizzard that hit the north country and the Buffalo area would not be as bad as the Blizzard of 1977. In that blizzard, it snowed for four late-January, early February days, leaving 66 inches of snow on the ground in Watertown and 80 inches in southern Jefferson County.
Mr. Kubis said the first thing he did when he saw December’s weather pattern developing into a potential blizzard, was to recall the 1977 storm.
“I was just a 7-year-old kid living just outside of Evans Mills,” he said. “But I looked at the upper air maps from back then and said, ‘This has a similar setup, but it’s not going to be as bad. The low isn’t going to be as nearly as deep and not as strong as a system.’ But it had similar characteristics.”
The old upper air maps, Mr. Kubis said, are provided by the government. “I have them tucked away on a thumbnail on my computer, where I can go back and look at historical surface and upper air maps from certain storms.”
Overall, Mr. Kubis said the technology now used to predict weather is vastly different from when he joined the Air Force — nine years before the ice storm.
“It’s like the difference between driving a Model A and a Lamborghini,” he said.
Mr. Zaff said technological abilities relating to forecasts continue to improve.
“We have a whole new generation of satellites coming out,” he said.
On Nov. 10, NOAA’s Joint Polar Satellite System-2, the third in a series of five advanced polar-orbiting satellites, was launched from Vandenberg Space Force Base in California.
Polar-orbiting satellites, which complement NWS geostationary satellites, constantly circle the Earth in an almost north-south orbit, passing close to both poles. According to a NWS news release, the Polar Operational Environmental Satellite system offers the advantage of daily global coverage, by making nearly polar orbits 14 times per day approximately 520 miles above the surface of the Earth. The Earth’s rotation allows the satellite to see a different view with each orbit, and each satellite provides two complete views of weather around the world each day.
Also as part of their mission, the satellites can receive, process and retransmit data from search and rescue beacon transmitters, and automatic data collection platforms on land, ocean buoys, or aboard free-floating balloons.
“Data from satellites like JPSS-2 are the foundation for our weather forecasts,” said Ken Graham, director of NOAA’s National Weather Service. “The constellation of weather satellites provides essential support to National Weather Service forecasters, which in turn, allows the public to be better prepared and for emergency managers to preposition response assets to save lives.”
A fair-weather ‘bet’
Closer to Earth, Mr. Mahar was asked about the outlook for the remaining winter and predictions for snowfall in northern New York. Thus far this season, the Watertown area has received about 107 inches of snow, according to data collected at the city’s water filtration plant. That puts the city already receiving more total snow this season than it did in 71 years between 1899 and now.
The most snow Watertown received in a season was 225.3 inches in 1899-1900.
“If you’re specifically talking about Watertown, Eastern Lake Ontario counties or Buffalo and the south towns there, I’d be willing to bet they’ve had most of their winter already, meaning the amount of snow,” Mr. Mahar said.
But, he added, “Don’t put away the snow shovel.”
The short-term forecast for Sunday is a high of 35 degrees with a “frozen mix.” The longer-range forecast for Sunday, Jan. 29: a high of 24 with a 40% chance of that pesky frozen mix.


Gloss