5G Technology Market Size to Grow by USD 128.46 billion | Deutsche Telekom AG, Intel Corp., Nokia Corp., and Qualcomm Inc. Emerge as Key Vendors Among Others
To get the exact yearly growth variance and the Y-O-Y growth rate, Talk to our analyst.
|
5G Technology Market Scope |
|
|
Report Coverage |
Details |
|
Page number |
120 |
|
Base year |
2021 |
|
Forecast period |
2022-2026 |
|
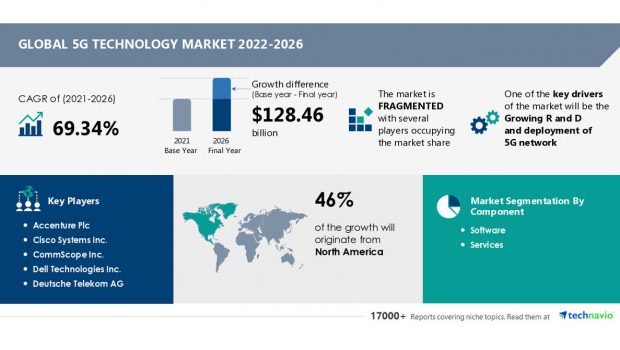
Growth momentum & CAGR |
Accelerate at a CAGR of 69.34% |
|
Market growth 2022-2026 |
$ 128.46 billion |
|
Market structure |
Fragmented |
|
YoY growth (%) |
67.81 |
|
Regional analysis |
North America, Europe, APAC, South America, and Middle East and Africa |
|
Performing market contribution |
North America at 46% |
|
Key consumer countries |
US, China, Japan, Germany, and UK |
|
Competitive landscape |
Leading companies, competitive strategies, consumer engagement scope |
|
Companies profiled |
Accenture Plc, Cisco Systems Inc., CommScope Inc., Dell Technologies Inc., Deutsche Telekom AG, Fujitsu Ltd., HCL Technologies Ltd., Huawei Technologies Co. Ltd., Intel Corp., Nokia Corp., Qualcomm Inc., Samsung Electronics Co. Ltd., Siemens AG, T Mobile US Inc., Tech Mahindra Ltd., Telefonaktiebolaget LM Ericsson, Telstra Corp. Ltd., TietoEVRY Corp., TIM S.p.A., and Viavi Solutions Inc. |
|
Market Dynamics |
Parent market analysis, Market growth inducers and obstacles, Fast-growing and slow-growing segment analysis, COVID 19 impact and future consumer dynamics, market condition analysis for forecast period. |
|
Customization purview |
If our report has not included the data that you are looking for, you can reach out to our analysts and get segments customized. |
Know more about the market scope and parent market analysis as you download your sample copy
Vendor Landscape
The 5G technology market is fragmented and the vendors are deploying growth strategies such as investments in R&D to compete in the market. To make the most of the opportunities and recover from post pandemic impact, market vendors should focus more on the growth prospects in the fast-growing segments, while maintaining their positions in the slow-growing segments. As the setting up of 5G networks requires government permission for which bids are announced, the competition is high among vendors.
Top 5G Technology Companies Covered with their Offerings
- Deutsche Telekom AG: The company offers 5G technology in industrial campus networks that makes it possible to deliver predictive maintenance of machines, or necessary changes in the production process can be made online.
- Huawei Technologies Co. Ltd.: The company offers 5G technology that provides solutions for commercial feasibility analysis, service development planning and design, product or offering design and GTM guidance, service operation strategy and guidance, value operation consulting, and operation optimization consulting.
- Intel Corp.: The company offers 5G technology that enables AI-driven business powered by cognitive reasoning, machine learning, and deep learning by tapping into massive amounts of data connected for the first time by pervasive networks.
- Nokia Corp.: The company offers 5G technology that helps to achieve more precise indoor and outdoor radio network planning using technologies such as multi-dimensional valuable area selection.
- Qualcomm Inc.: The company offers 5G technology that enables applications to provide real-time insights using Intelligent Wireless Edge, a new distributed intelligence paradigm to deliver a scalable and efficient 5G expansion, bringing benefits such as lower latency and better privacy.
Some other companies covered in this report are:
- Samsung Electronics Co. Ltd.
- Siemens AG
- T Mobile US Inc.
- Tech Mahindra Ltd.
- Telefonaktiebolaget LM Ericsson
- Telstra Corp. Ltd.
- TietoEVRY Corp.
- TIM S.p.A.
- Viavi Solutions Inc.
- Fujitsu Ltd.
- HCL Technologies Ltd.
- Accenture Plc
- Cisco Systems Inc.
- CommScope Inc.
- Dell Technologies Inc.
Key Market Dynamics:
- Market Driver: The growing R&D and deployment of 5G network will be influencial in driving the market growth during the forecast period. The evolution of 5G technology will compel market vendors to develop wireless test equipment that can support the technology effectively. The Government of India is also working to create a fund for the development of 5G technology, which will further drive the market growth during the forecast period. In addition, strategic collaboration among market participants is one of the key 5G technology market trends that is expected to impact the industry positively in the forecast period. Various governments are working on a collaboration with market participants to accelerate the deployment of 5G technology.
- Market Challenge: The high deployment cost of 5G technology will emerge as the key factor hindering the market growth. The deployment cost for LTE infrastructure alone will be more than USD 200 billion, which would be greater than upgrade costs and virtual data center processing costs. Designing and maintaining complex network virtual applications within an allocated budget is important for efficient 5G operations.
To learn about additional key drivers, trends, and challenges available with Technavio. Read our Sample Report
Revenue-Generating Segment Highlights
The 5G technology market report is segmented by Component (Software and Services), End-user (Manufacturing, Automotive, Energy and utilities, and Others), and Geography (North America, Europe, APAC, South America, and Middle East and Africa).
- The software component segment accounted for the largest 5G technology market share in 2021. The segment will continue to account for the highest share throughout the forecast period. Software-defined networking (SDN) is an approach to networking that uses software-based controllers or application programming interfaces (APIs) to communicate with underlying hardware infrastructure and direct traffic on a network.
- North America will be the leading region with 46% of the market's growth during the forecast period. US and Canada are the key markets for 5G technology in North America. Market growth in this region will be faster than the growth of the market in Europe. The increasing adoption of wireless technologies in countries such as the US will propel the 5G technology market growth in North America over the forecast period.
View our sample report for insights into the contribution of all the segments and regional opportunities
Related Reports:
5G Testing Equipment Market by Product and Geography - Forecast and Analysis 2021-2025
5G Enterprise Market by Service and Geography - Forecast and Analysis 2022-2026
Key Topics Covered:
1 Executive Summary
- 1.1 Market overview
- Exhibit 01: Executive Summary – Chart on Market Overview
- Exhibit 02: Executive Summary – Data Table on Market Overview
- Exhibit 03: Executive Summary – Chart on Global Market Characteristics
- Exhibit 04: Executive Summary – Chart on Market by Geography
- Exhibit 05: Executive Summary – Chart on Market Segmentation by Component
- Exhibit 06: Executive Summary – Chart on Market Segmentation by End-user
- Exhibit 07: Executive Summary – Chart on Incremental Growth
- Exhibit 08: Executive Summary – Data Table on Incremental Growth
- Exhibit 09: Executive Summary – Chart on Vendor Market Positioning
2 Market Landscape
- 2.1 Market ecosystem
- Exhibit 10: Parent market
- Exhibit 11: Market Characteristics
3 Market Sizing
- 3.1 Market definition
- Exhibit 12: Offerings of vendors included in the market definition
- 3.2 Market segment analysis
- Exhibit 13: Market segments
- 3.4 Market outlook: Forecast for 2021-2026
- Exhibit 14: Chart on Global - Market size and forecast 2021-2026 ($ billion)
- Exhibit 15: Data Table on Global - Market size and forecast 2021-2026 ($ billion)
- Exhibit 16: Chart on Global Market: Year-over-year growth 2021-2026 (%)
- Exhibit 17: Data Table on Global Market: Year-over-year growth 2021-2026 (%)
4 Five Forces Analysis
- 4.1 Five forces summary
- Exhibit 18: Five forces analysis - Comparison between 2021 and 2026
- 4.2 Bargaining power of buyers
- Exhibit 19: Chart on Bargaining power of buyers – Impact of key factors 2021 and 2026
- 4.3 Bargaining power of suppliers
- Exhibit 20: Bargaining power of suppliers – Impact of key factors in 2021 and 2026
- 4.4 Threat of new entrants
- Exhibit 21: Threat of new entrants – Impact of key factors in 2021 and 2026
- 4.5 Threat of substitutes
- Exhibit 22: Threat of substitutes – Impact of key factors in 2021 and 2026
- 4.6 Threat of rivalry
- Exhibit 23: Threat of rivalry – Impact of key factors in 2021 and 2026
- 4.7 Market condition
- Exhibit 24: Chart on Market condition - Five forces 2021 and 2026
5 Market Segmentation by Component
- 5.1 Market segments
- Exhibit 25: Chart on Component - Market share 2021-2026 (%)
- Exhibit 26: Data Table on Component - Market share 2021-2026 (%)
- 5.2 Comparison by Component
- Exhibit 27: Chart on Comparison by Component
- Exhibit 28: Data Table on Comparison by Component
- 5.3 Software - Market size and forecast 2021-2026
- Exhibit 29: Chart on Software - Market size and forecast 2021-2026 ($ billion)
- Exhibit 30: Data Table on Software - Market size and forecast 2021-2026 ($ billion)
- Exhibit 31: Chart on Software - Year-over-year growth 2021-2026 (%)
- Exhibit 32: Data Table on Software - Year-over-year growth 2021-2026 (%)
- 5.4 Services - Market size and forecast 2021-2026
- Exhibit 33: Chart on Services - Market size and forecast 2021-2026 ($ billion)
- Exhibit 34: Data Table on Services - Market size and forecast 2021-2026 ($ billion)
- Exhibit 35: Chart on Services - Year-over-year growth 2021-2026 (%)
- Exhibit 36: Data Table on Services - Year-over-year growth 2021-2026 (%)
- 5.5 Market opportunity by Component
- Exhibit 37: Market opportunity by Component ($ billion)
6 Market Segmentation by End-user
- 6.1 Market segments
- Exhibit 38: Chart on End-user - Market share 2021-2026 (%)
- Exhibit 39: Data Table on End-user - Market share 2021-2026 (%)
- 6.2 Comparison by End-user
- Exhibit 40: Chart on Comparison by End-user
- Exhibit 41: Data Table on Comparison by End-user
- 6.3 Manufacturing - Market size and forecast 2021-2026
- Exhibit 42: Chart on Manufacturing - Market size and forecast 2021-2026 ($ billion)
- Exhibit 43: Data Table on Manufacturing - Market size and forecast 2021-2026 ($ billion)
- Exhibit 44: Chart on Manufacturing - Year-over-year growth 2021-2026 (%)
- Exhibit 45: Data Table on Manufacturing - Year-over-year growth 2021-2026 (%)
- 6.4 Automotive - Market size and forecast 2021-2026
- Exhibit 46: Chart on Automotive - Market size and forecast 2021-2026 ($ billion)
- Exhibit 47: Data Table on Automotive - Market size and forecast 2021-2026 ($ billion)
- Exhibit 48: Chart on Automotive - Year-over-year growth 2021-2026 (%)
- Exhibit 49: Data Table on Automotive - Year-over-year growth 2021-2026 (%)
- 6.5 Energy and utilities - Market size and forecast 2021-2026
- Exhibit 50: Chart on Energy and utilities - Market size and forecast 2021-2026 ($ billion)
- Exhibit 51: Data Table on Energy and utilities - Market size and forecast 2021-2026 ($ billion)
- Exhibit 52: Chart on Energy and utilities - Year-over-year growth 2021-2026 (%)
- Exhibit 53: Data Table on Energy and utilities - Year-over-year growth 2021-2026 (%)
- 6.6 Others - Market size and forecast 2021-2026
- Exhibit 54: Chart on Others - Market size and forecast 2021-2026 ($ billion)
- Exhibit 55: Data Table on Others - Market size and forecast 2021-2026 ($ billion)
- Exhibit 56: Chart on Others - Year-over-year growth 2021-2026 (%)
- Exhibit 57: Data Table on Others - Year-over-year growth 2021-2026 (%)
- 6.7 Market opportunity by End-user
- Exhibit 58: Market opportunity by End-user ($ billion)
7 Customer Landscape
- 7.1 Customer landscape overview
- Exhibit 59: Analysis of price sensitivity, lifecycle, customer purchase basket, adoption rates, and purchase criteria
8 Geographic Landscape
- 8.1 Geographic segmentation
- Exhibit 60: Chart on Market share by geography 2021-2026 (%)
- Exhibit 61: Data Table on Market share by geography 2021-2026 (%)
- 8.2 Geographic comparison
- Exhibit 62: Chart on Geographic comparison
- Exhibit 63: Data Table on Geographic comparison
- 8.3 North America - Market size and forecast 2021-2026
- Exhibit 64: Chart on North America - Market size and forecast 2021-2026 ($ billion)
- Exhibit 65: Data Table on North America - Market size and forecast 2021-2026 ($ billion)
- Exhibit 66: Chart on North America - Year-over-year growth 2021-2026 (%)
- Exhibit 67: Data Table on North America - Year-over-year growth 2021-2026 (%)
- 8.4 Europe - Market size and forecast 2021-2026
- Exhibit 68: Chart on Europe - Market size and forecast 2021-2026 ($ billion)
- Exhibit 69: Data Table on Europe - Market size and forecast 2021-2026 ($ billion)
- Exhibit 70: Chart on Europe - Year-over-year growth 2021-2026 (%)
- Exhibit 71: Data Table on Europe - Year-over-year growth 2021-2026 (%)
- 8.5 APAC - Market size and forecast 2021-2026
- Exhibit 72: Chart on APAC - Market size and forecast 2021-2026 ($ billion)
- Exhibit 73: Data Table on APAC - Market size and forecast 2021-2026 ($ billion)
- Exhibit 74: Chart on APAC - Year-over-year growth 2021-2026 (%)
- Exhibit 75: Data Table on APAC - Year-over-year growth 2021-2026 (%)
- 8.6 South America - Market size and forecast 2021-2026
- Exhibit 76: Chart on South America - Market size and forecast 2021-2026 ($ billion)
- Exhibit 77: Data Table on South America - Market size and forecast 2021-2026 ($ billion)
- Exhibit 78: Chart on South America - Year-over-year growth 2021-2026 (%)
- Exhibit 79: Data Table on South America - Year-over-year growth 2021-2026 (%)
- 8.7 Middle East and Africa - Market size and forecast 2021-2026
- Exhibit 80: Chart on Middle East and Africa - Market size and forecast 2021-2026 ($ billion)
- Exhibit 81: Data Table on Middle East and Africa - Market size and forecast 2021-2026 ($ billion)
- Exhibit 82: Chart on Middle East and Africa - Year-over-year growth 2021-2026 (%)
- Exhibit 83: Data Table on Middle East and Africa - Year-over-year growth 2021-2026 (%)
- 8.8 US - Market size and forecast 2021-2026
- Exhibit 84: Chart on US - Market size and forecast 2021-2026 ($ billion)
- Exhibit 85: Data Table on US - Market size and forecast 2021-2026 ($ billion)
- Exhibit 86: Chart on US - Year-over-year growth 2021-2026 (%)
- Exhibit 87: Data Table on US - Year-over-year growth 2021-2026 (%)
- 8.9 China - Market size and forecast 2021-2026
- Exhibit 88: Chart on China - Market size and forecast 2021-2026 ($ billion)
- Exhibit 89: Data Table on China - Market size and forecast 2021-2026 ($ billion)
- Exhibit 90: Chart on China - Year-over-year growth 2021-2026 (%)
- Exhibit 91: Data Table on China - Year-over-year growth 2021-2026 (%)
- 8.10 Germany - Market size and forecast 2021-2026
- Exhibit 92: Chart on Germany - Market size and forecast 2021-2026 ($ billion)
- Exhibit 93: Data Table on Germany - Market size and forecast 2021-2026 ($ billion)
- Exhibit 94: Chart on Germany - Year-over-year growth 2021-2026 (%)
- Exhibit 95: Data Table on Germany - Year-over-year growth 2021-2026 (%)
- 8.11 UK - Market size and forecast 2021-2026
- Exhibit 96: Chart on UK - Market size and forecast 2021-2026 ($ billion)
- Exhibit 97: Data Table on UK - Market size and forecast 2021-2026 ($ billion)
- Exhibit 98: Chart on UK - Year-over-year growth 2021-2026 (%)
- Exhibit 99: Data Table on UK - Year-over-year growth 2021-2026 (%)
- 8.12 Japan - Market size and forecast 2021-2026
- Exhibit 100: Chart on Japan - Market size and forecast 2021-2026 ($ billion)
- Exhibit 101: Data Table on Japan - Market size and forecast 2021-2026 ($ billion)
- Exhibit 102: Chart on Japan - Year-over-year growth 2021-2026 (%)
- Exhibit 103: Data Table on Japan - Year-over-year growth 2021-2026 (%)
- 8.13 Market opportunity by geography
- Exhibit 104: Market opportunity by geography ($ billion)
9 Drivers, Challenges, and Trends
- 9.3 Impact of drivers and challenges
- Exhibit 105: Impact of drivers and challenges in 2021 and 2026
10 Vendor Landscape
- 10.2 Vendor landscape
- Exhibit 106: Overview on Criticality of inputs and Factors of differentiation
- 10.3 Landscape disruption
- Exhibit 107: Overview on factors of disruption
- 10.4 Industry risks
- Exhibit 108: Impact of key risks on business
11 Vendor Analysis
- 11.1 Vendors covered
- Exhibit 109: Vendors covered
- 11.2 Market positioning of vendors
- Exhibit 110: Matrix on vendor position and classification
- 11.3 Cisco Systems Inc.
- Exhibit 111: Cisco Systems Inc. - Overview
- Exhibit 112: Cisco Systems Inc. - Business segments
- Exhibit 113: Cisco Systems Inc. - Key news
- Exhibit 114: Cisco Systems Inc. - Key offerings
- Exhibit 115: Cisco Systems Inc. - Segment focus
- 11.4 Deutsche Telekom AG
- Exhibit 116: Deutsche Telekom AG - Overview
- Exhibit 117: Deutsche Telekom AG - Business segments
- Exhibit 118: Deutsche Telekom AG - Key offerings
- Exhibit 119: Deutsche Telekom AG - Segment focus
- 11.5 Huawei Technologies Co. Ltd.
- Exhibit 120: Huawei Technologies Co. Ltd. - Overview
- Exhibit 121: Huawei Technologies Co. Ltd. - Business segments
- Exhibit 122: Huawei Technologies Co. Ltd. - Key offerings
- Exhibit 123: Huawei Technologies Co. Ltd. - Segment focus
- 11.6 Intel Corp.
- Exhibit 124: Intel Corp. - Overview
- Exhibit 125: Intel Corp. - Business segments
- Exhibit 126: Intel Corp. - Key news
- Exhibit 127: Intel Corp. - Key offerings
- Exhibit 128: Intel Corp. - Segment focus
- 11.7 Nokia Corp.
- Exhibit 129: Nokia Corp. - Overview
- Exhibit 130: Nokia Corp. - Business segments
- Exhibit 131: Nokia Corp. - Key offerings
- Exhibit 132: Nokia Corp. - Segment focus
- 11.8 Qualcomm Inc.
- Exhibit 133: Qualcomm Inc. - Overview
- Exhibit 134: Qualcomm Inc. - Business segments
- Exhibit 135: Qualcomm Inc. - Key news
- Exhibit 136: Qualcomm Inc. - Key offerings
- Exhibit 137: Qualcomm Inc. - Segment focus
- 11.9 T Mobile US Inc.
- Exhibit 138: T Mobile US Inc. - Overview
- Exhibit 139: T Mobile US Inc. - Product / Service
- Exhibit 140: T Mobile US Inc. - Key offerings
- 11.10 Telefonaktiebolaget LM Ericsson
- Exhibit 141: Telefonaktiebolaget LM Ericsson - Overview
- Exhibit 142: Telefonaktiebolaget LM Ericsson - Business segments
- Exhibit 143: Telefonaktiebolaget LM Ericsson - Key news
- Exhibit 144: Telefonaktiebolaget LM Ericsson - Key offerings
- Exhibit 145: Telefonaktiebolaget LM Ericsson - Segment focus
- 11.11 Telstra Corp. Ltd.
- Exhibit 146: Telstra Corp. Ltd. - Overview
- Exhibit 147: Telstra Corp. Ltd. - Business segments
- Exhibit 148: Telstra Corp. Ltd. - Key offerings
- Exhibit 149: Telstra Corp. Ltd. - Segment focus
- 11.12 TIM S.p.A.
- Exhibit 150: TIM S.p.A. - Overview
- Exhibit 151: TIM S.p.A. - Business segments
- Exhibit 152: TIM S.p.A. - Key offerings
- Exhibit 153: TIM S.p.A. - Segment focus
12 Appendix
- 12.2 Inclusions and exclusions checklist
- Exhibit 154: Inclusions checklist
- Exhibit 155: Exclusions checklist
- 12.3 Currency conversion rates for US$
- Exhibit 156: Currency conversion rates for US$
- 12.4 Research methodology
- Exhibit 157: Research methodology
- Exhibit 158: Validation techniques employed for market sizing
- Exhibit 159: Information sources
- 12.5 List of abbreviations
- Exhibit 160: List of abbreviations
About Us
Technavio is a leading global technology research and advisory company. Their research and analysis focuses on emerging market trends and provides actionable insights to help businesses identify market opportunities and develop effective strategies to optimize their market positions. With over 500 specialized analysts, Technavio's report library Their client base consists of enterprises of all sizes, including more than 100 Fortune 500 companies. This growing client base relies on Technavio's comprehensive coverage, extensive research, and actionable market insights to identify opportunities in existing and potential markets and assess their competitive positions within changing market scenarios.
Contact
Technavio Research
Jesse Maida
Media & Marketing Executive
US: +1 844 364 1100
UK: +44 203 893 3200
Email:[email protected]
Website: www.technavio.com/
SOURCE Technavio


Gloss