Loading Kernel Shellcode
In the wake of recent hacking tool dumps, the FLARE team saw a spike
in malware samples detonating kernel shellcode. Although most samples
can be analyzed statically, the FLARE team sometimes debugs these
samples to confirm specific functionality. Debugging can be an
efficient way to get around packing or obfuscation and quickly
identify the structures, system routines, and processes that a kernel
shellcode sample is accessing.
This post begins a series centered on kernel software analysis, and
introduces a tool that uses a custom Windows kernel driver to load and
execute Windows kernel shellcode. I’ll walk through a brief case study
of some kernel shellcode, how to load shellcode with FLARE’s kernel
shellcode loader, how to build your own copy, and how it works.
As always, only analyze malware in a safe environment such as a VM;
never use tools such as a kernel shellcode loader on any system that
you rely on to get your work done.
A Tale of Square Pegs and Round Holes
Depending upon how a shellcode sample is encountered, the analyst
may not know whether it is meant to target user space or kernel space.
A common triage step is to load the sample in a shellcode loader and
debug it in user space. With kernel shellcode, this can have
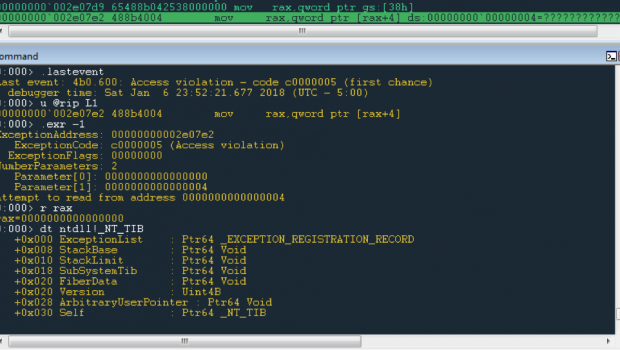
unexpected results such as the access violation in Figure 1.
Figure 1: Access violation from shellcode
dereferencing null pointer
The kernel environment is a world apart from user mode: various
registers take on different meanings and point to totally different
structures. For instance, while the gs segment register in 64-bit
Windows user mode points to the Thread Information Block (TIB) whose
size is only 0x38 bytes, in kernel mode it points to the Processor
Control Region (KPCR) which is much larger. In Figure 1 at address
0x2e07d9, the shellcode is attempting to access the IdtBase member of
the KPCR, but because it is running in user mode, the value at offset
0x38 from the gs segment is null. This causes the next instruction to
attempt to access invalid memory in the NULL page. What the code is
trying to do doesn’t make sense in the user mode environment, and it
has crashed as a result.
In contrast, kernel mode is a perfect fit. Figure 2 shows WinDbg’s
dt command being used to display the _KPCR type defined within
ntoskrnl.pdb, highlighting the field at offset 0x38 named IdtBase.

Figure 2: KPCR structure
Given the rest of the code in this sample, accessing the IdtBase
field of the KPCR made perfect sense. Determining that this was kernel
shellcode allowed me to quickly resolve the rest of my questions, but
to confirm my findings, I wrote a kernel shellcode loader. Here’s what
it looks like to use this tool to load a small, do-nothing piece of shellcode.
Using FLARE’s Kernel Shellcode Loader
I booted a target system with a kernel debugger and opened an
administrative command prompt in the directory where I copied the
shellcode loader (kscldr.exe). The shellcode loader expects to receive
the name of the file on disk where the shellcode is located as its
only argument. Figure 3 shows an example where I’ve used a hex editor
to write the opcodes for the NOP (0x90) and RET (0xC3) instructions
into a binary file and invoked kscldr.exe to pass that code to the
kernel shellcode loader driver. I created my file using the Windows
port of xxd that comes with Vim for Windows.

Figure 3: Using kscldr.exe to load kernel shellcode
The shellcode loader prompts with a security warning. After clicking
yes, kscldr.exe installs its driver and uses it to execute the
shellcode. The system is frozen at this point because the kernel
driver has already issued its breakpoint and the kernel debugger is
awaiting commands. Figure 4 shows WinDbg hitting the breakpoint and
displaying the corresponding source code for kscldr.sys.

Figure 4: Breaking in kscldr.sys
From the breakpoint, I use WinDbg with source-level debugging to
step and trace into the shellcode buffer. Figure 5 shows WinDbg’s
disassembly of the buffer after doing this.

Figure 5: Tracing into and disassembling
the shellcode
The disassembly shows the 0x90 and 0xc3 opcodes from before,
demonstrating that the shellcode buffer is indeed being executed. From
here, the powerful facilities of WinDbg are available to debug and
analyze the code’s behavior.
Building It Yourself
To try out FLARE’s kernel shellcode loader for yourself, you’ll need
to download the
source code.
To get started building it, download and install the Windows
Driver Kit (WDK). I’m using Windows
Driver Kit Version 7.1.0, which is command line driven, whereas
more modern versions of the WDK integrate with Visual Studio. If you
feel comfortable using a newer kit, you’re welcomed to do so, but
beware, you’ll have to take matters into your own hands regarding
build commands and dependencies. Since WDK 7.1.0 is adequate for
purposes of this tool, that is the version I will describe in this post.
Once you have downloaded and installed the WDK, browse to the
Windows Driver Kits directory in the start menu on your development
system and select the appropriate environment. Figure 6 shows the WDK
program group on a Windows 7 system. The term “checked build”
indicates that debugging checks will be included. I plan to load
64-bit kernel shellcode, and I like having Windows catch my mistakes
early, so I’m using the x64 Checked Build Environment.

Figure 6: Windows Driver Kits program group
In the WDK command prompt, change to the directory where you
downloaded the FLARE kernel shellcode loader and type ez.cmd. The
script will cause prompts to appear asking you to supply and use a
password for a test signing certificate. Once the build completes,
visit the bin directory and copy kscldr.exe to your debug target.
Before you can commence using your custom copy of this tool, you’ll
need to follow just a few more steps to prepare the target system to
allow it.
Preparing the Debug Target
To debug kernel shellcode, I wrote a Windows software-only driver
that loads and runs shellcode at privilege level 0. Normally, Windows
only loads drivers that are signed with a special cross-certificate,
but Windows allows you to enable
testsigning to load drivers signed with a test certificate. We can
create this test certificate for free, and it won’t allow the driver
to be loaded on production systems, which is ideal.
In addition to enabling testsigning mode, it is necessary to enable
kernel debugging to be able to really follow what is happening after
the kernel shellcode gains execution. Starting with Windows Vista, we
can enable both testsigning and kernel debugging by issuing the
following two commands in an administrative command prompt followed by
a reboot:
|
bcdedit.exe /set testsigning bcdedit.exe /set debug on |
For debugging in a VM, I install VirtualKD, but you can also
follow your virtualization vendor’s directions for connecting a serial
port to a named pipe or other mechanism that WinDbg understands. Once
that is set up and tested, we’re ready to go!
If you try the shellcode loader and get a blue screen indicating
stop code 0x3B (SYSTEM_SERVICE_EXCEPTION), then you likely did not
successfully connect the kernel debugger beforehand. Remember that the
driver issues a software interrupt to give control to the debugger
immediately before executing the shellcode; if the debugger is not
successfully attached, Windows will blue screen. If this was the case,
reboot and try again, this time first confirming that the debugger is
in control by clicking Debug -> Break in WinDbg. Once
you know you have control, you can issue the g command to let
execution continue (you may need to disable driver load notifications
to get it to finish the boot process without further intervention: sxd ld).
How It Works
The user-space application (kscldr.exe) copies the driver from a
PE-COFF resource to the disk and registers it as a Windows kernel
service. The driver implements device write and I/O control routines
to allow interaction from the user application. Its driver entry point
first registers dispatch routines to handle CreateFile, WriteFile,
DeviceIoControl, and CloseHandle. It then creates a device named
Devicekscldr and a symbolic link making the device name accessible
from user-space. When the user application opens the device file and
invokes WriteFile, the driver calls ExAllocatePoolWithTag specifying a
PoolType of NonPagedPool (which
is executable), and writes the buffer to the newly allocated
memory. After the write operation, the user application can call
DeviceIoControl to call into the shellcode. In response, the driver
sets the appropriate flags on the device object, issues a breakpoint
to pass control to the kernel debugger, and finally calls the
shellcode as if it were a function.
While You’re Here
Driver development opens the door to unique instrumentation
opportunities. For example, Figure 7 shows a few kernel callback
routines described in the WDK help files that can track system-wide
process, thread, and DLL activity.

Figure 7: WDK kernel-mode driver
architecture reference
Kernel development is a deep subject that entails a great deal of
study, but the WDK also comes with dozens upon dozens of sample
drivers that illustrate correct Windows kernel programming techniques.
This is a treasure trove of Windows internals information, security
research topics, and instrumentation possibilities. If you have time,
take a look around before you get back to work.
Wrap-Up
We’ve shared FLARE’s tool for loading privileged shellcode in test
environments so that we can dynamically analyze kernel shellcode. We
hope this provides a straightforward way to quickly triage kernel
shellcode if it ever appears in your environment. Download the source code now.
Do you want to learn more about these tools and techniques from
FLARE? Then you should take one of our Black Hat classes in Las Vegas
this summer! Our offerings include Malware
Analysis Crash Course, macOS
Malware for Reverse Engineers, and Malware
Analysis Master Class.


Gloss