Kornit Digital: Technology In Textiles (NASDAQ:KRNT)
Investing Theme
It is smart to have big money institutions long your holdings. They want to see those stocks’ prices rise, the sooner the better. They have the money muscle to create that kind of environment, whether you own them or not, so why not?
When they buy, the Market-Makers helping them have a sense of how far up the big money clients are likely to push. The MM will usually have to “fill” their buy orders by shorting the difference in market-available shares by borrowing what is needed from holders willing to earn a temporary lender’s fee.
Don’t worry for the MMs, they constantly find ways to cover shorts, but meanwhile, we have their informed forecasts to compare with market outcomes of like hedges of the past 5 years, where upside-to-downside expectations proportions are like those of now.
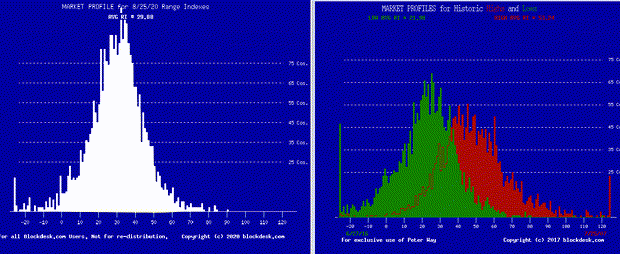
We will start with an analysis of Kornit Digital Ltd. (KRNT).
But is this market at an extreme? Does it matter?
With comparable coming-price expectations for over 2800 stocks, ETFs, and indexes, we have a comprehensive view of the pros’ view, backed up by real money commitments. It is produced every day, so we have good records of when it gets to extremes. Figure 1 provides today’s Market Profile frequency distribution of MM forecast Range Indexes [RI] along with times of overpriced and underpriced markets. A Range Index number is the percentage of the whole forecast range between the market close price and the forecast low.
Figure 1
Source: Author
Today’s RI of 29 is midway between low markets with RIs averaging 20 or less and high markets averaging RIs of 40. Don’t think of 50 as a norm: Would you buy a stock with as much downside price change risk as upside gain potential? Besides the risk-reward balance issue, narrow distributions of forecasts suggest more index stability than times when forecasts of individual securities range widely across possible potential price changes.
What do you see now?
What is so interesting about Kornit Digital?
Description
Kornit Digital Ltd. develops, designs, and markets digital printing solutions for the fashion, apparel, and home decor segments of printed textile industry worldwide. The company's solutions include digital printing systems, ink and other consumables, associated software, and value-added services. Its products and services include direct-to-garment printing systems from smaller industrial operators to mass producers; NeoPigment ink and other consumables; QuickP designer software; and maintenance and support, and professional services. The company serves decorators, online businesses, brand owners, and contract printers. Kornit Digital was founded in 2002 and is headquartered in Rosh-Ha`Ayin, Israel.

(Source: Yahoo Finance)
Promise is one thing, performance can be another. Quantity over quality may thrill some investors, but most look for risk restraint along with reward opportunity. You can’t have one without the other. To find a balance, we need to know what is being offered.
That is presented in an analysis of some 2800 stocks most likely to produce satisfying rates of capital gain under the portfolio management discipline known as TERMD, explained in the article titled "How To Better-Than-Double Your Capital Gains (From Stocks Alone) By Using TERMD Portfolio Discipline" in my SA blog.
The discipline seeks the largest, most likely, quickest to be captured net capital gains with the least interim exposure to price drawdown on the way to target reward attainment. The same discipline is applied in Figure 2 to the blue rows of market index ETF (SPY), our MM-forecast population 2800-securities aggregate, and its top-ranked 20 stocks or ETFs.
Figure 2

(Source: Author)
Figure 2 presents the MMs’ price range forecasts for our principal-interest investment candidate and their two market-average alternatives, along with the histories of outcomes from the prior forecasts having the same proportions of upside-to-downside prospects as today’s.
This table presents data on those stocks most likely to produce satisfying rates of capital gain under the portfolio management discipline known as TERMD, explained in the article linked above.
That discipline seeks the largest, most likely, quickest to be captured net capital gains with the least interim exposure to price drawdown on the way to target reward attainment. For comparison to KRNT, it is applied in Figure 2 to the blue rows of market index ETF (SPY), our MM-forecast population 2800-securities aggregate, and its top-ranked 20 stocks.
The gains and risks of Figure 2 are in columns of [E] and [F]. KRNT’s +17.2% upside prospect from [D] $60.30 to [B] $70.68 compares with SPY’s upside potential of +12.0%. The risk exposures data of [F] draw from prior experiences rather than from current forecasts. Indeed, market circumstances often make current price risk forecasts an underestimation of what may ultimately occur. They may be more beneficial to the sellers of insurance than to the buyers.
But instead, the [F] data is an average of the worst instance of actual interim price drawdown below the position’s entry cost in each of the prior [L] forecasts like [G] during the [J] days the position was held. It measures the true price risks actually encountered as a result of the relevant forecasts, not just of some prior calendar historic extreme.
The “proof” of the coming-price “pudding” is suggested by what proportion of those [L] forecast outcomes wound up at a profit - shown as a % of 100 in [H]. This important dimension is used to weight the actual [I] payoffs realized as a ranking figure of merit (fom) when teamed up with a similar offset of [F] weighted by the complement of [H], or 100-H. That action takes place in [O] and [P] when combined in [Q].
While [Q] suggests a sense of scale, its calibration by the TIME required in [J] converts the scale into speed in [R]. The speed is stated in conventional financial industry terms of “basis points per day”, or bp/d. A basis point is 1/100ths of a percent, and in a calendar year of 365 days, 19 bp/d sustained for a year doubles the capital invested. On the 252-day market year, it takes 27.5 bp/md.
KRNT’s bp/md of 51.7 is equal to more than a CAGR of +290%, and SPY’s 4.6 bp/md produces a CAGR of 19%, where the AGR of CAGR is an annual growth rate of 252 market days.
Figure 2’s column [R] provides an inclusive “figure of merit” (fom) useful for preference-ranking of securities where capital building is of importance in future expectations. The foms show how different the prospects for KRNT are compared to SPY, the SPDR S&P 500 Trust ETF (SPY) as a market proxy.
When price range forecasts from qualified appraisers are available on a large population of equity securities, as they are in our population of over 2800 MM forecasts, a further notion of opportunity norms is available. Many past history “norms” of indexes like SPY exist, but very few are selective averages of forecasts like the +19.0% upside and -10.8% downside of this population.
The principal limitation of our broad market expectations measure is that its forecast horizon is limited to the legal lives of the derivative contracts used to imply the range of coming prices. That horizon typically is limited to a few months. The TERMD risk management discipline referred to earlier sets a time investment cut-off at 3 months.
The figure of merit [R] ranking has a multi-year daily history of capital gain (and loss) outcomes for the best odds-on outlooks in the MM forecast population. The top20 bottom blue row of Figure 3 provides an appropriate contrast with the row-above population.
The top20 now shows an upside price change prospect of some +15.1% gain potential, less than the population’s +19%. But its price change risk outlook is so much lower: only -7.6%, compared to -10.8%. The payoff advantage appears in [I], where gains of +12.7% have been achieved from top20 prior forecasts, compared to the population’s mere +3.4% and SPY’s +4.1%.
Higher-risk experiences are the population culprit. Only 6 out of every 10 population forecasts have been [H] winners (profitable under TERMD discipline), compared to 7 out of every 8 of the top20’s. Time investments also “contribute” to the population’s worst losses, turning an overall average gain into a fom net loss, the negative of that had by SPY.
The top20’s smaller time investment of 35-day holding periods boosts its bp/d fom score. Compounding time investment efficiency with realized payoffs is very powerful, producing triple-digit CAGRs quite frequently.
What has been KRNT’s recent past forecasts trend?

Source: Author
Comparisons
The article’s purpose of examining a logical preference today between KRNT and market alternatives puts the stock out front in that contest on several fronts. But a less-discussed one may best be not overlooked: the Realized Payoff [I] difference. KRNT has captured more than its [E] 17.2% implied price forecast upside, shown by a [N] Credibility Ratio of 1.41. Compared to even the best 20 stocks, it beats their 0.84 capture of only 12.7% of its +15.1% [E] upside. This difference may be largely due to KRNT’s industry technology advantage.
The Win Odds [H] of both KRNT and the forecast population’s top 20 are a high profitability of 7 out of every 8 or nearly 90 of 100. But KRNT’s price realizations produce nearly twice as much payoff in only one week more than SPY’s seven.
Conclusion
Extensive comparisons make Kornit Digital a better choice at present prices and prospects for stock near-term capital gain than even the average of the 20 best stocks in a forecast population of over 2800.
Additional disclosure: Disclaimer: Peter Way and generations of the Way Family are long-term providers of perspective information, earlier helping professional investors and now individual investors, discriminate between wealth-building opportunities in individual stocks and ETFs. We do not manage money for others outside of the family but do provide pro bono consulting for a limited number of not-for-profit organizations.We firmly believe investors need to maintain skin in their game by actively initiating commitment choices of capital and time investments in their personal portfolios. So, our information presents for D-I-Y investor guidance what the arguably best-informed professional investors are thinking. Their insights, revealed through their own self-protective hedging actions, tell what they believe is most likely to happen to the prices of specific issues in coming weeks and months. First months of 2020 to date have produced over 2400 profitable position closeouts in a 75%/25% win-loss ratio. Evidences of how such prior forecasts have worked out are routinely provided in the SA blog of my name.
Disclosure: I/we have no positions in any stocks mentioned, but may initiate a long position in KRNT over the next 72 hours. I wrote this article myself, and it expresses my own opinions. I am not receiving compensation for it (other than from Seeking Alpha). I have no business relationship with any company whose stock is mentioned in this article.


Gloss