Introducing Monitor.app for macOS
UPDATE 2 (Oct. 24, 2018): Monitor.app now supports macOS 10.14.
UPDATE (April 4, 2018): Monitor.app now supports macOS 10.13.
As a malware analyst or systems programmer, having a suite of solid
dynamic analysis tools is vital to being quick and effective. These
tools enable us to understand malware capabilities and undocumented
components of the operating system. One obvious tool that comes to
mind is Procmon
from the legendary Sysinternals Suite from Microsoft. Those
tools only work on Windows though and we love macOS.
macOS has some fantastic dynamic instrumentation software included
with the operating system and Xcode. In the past, we have used dynamic
instrumentation tools such as Dtrace,
a very powerful tracing subsystem built into the core of macOS. While
it is very powerful and efficient, it commonly required us to write D
scripts to get the interesting bits. We wanted something simpler.
Today, the Innovation and Custom Engineering (ICE) Applied Research
team presents the public release of Monitor.app
for macOS, a simple GUI application for monitoring common system
events on a macOS host. Monitor.app captures the following event types:
- Process execution with command line arguments
- File
creates (if data is written) - File renames
- Network
activity - DNS requests and replies
- Dynamic library
loads - TTY Events
Monitor.app identifies system activities using a kernel extension
(kext). Its focus is on capturing data that matters, with context.
These events are presented in the UI with a rich search capability
allowing users to hunt through event data for areas of interest.
The goal of Monitor is simplicity. When launching Monitor, the user
is prompted for root credentials to launch a process and load our kext
(don’t worry, the main UI process doesn’t run as root). From there,
the user can click on the start button and watch the events roll in!
The UI is sparse with a few key features. There is the start/stop
button, filter buttons, and a search bar. The search bar allows us to
set simple filters on types of data we may want to filter or search
for over all events. The event table is a listing of all the events
Monitor is capable of presenting to the user. The filter buttons allow
the user to turn off some classes of events. For example, if a
TimeMachine backup were to kick off when the user was trying to
analyze a piece of malware, the user can click the file system filter
button and the file write events won’t clutter the display.
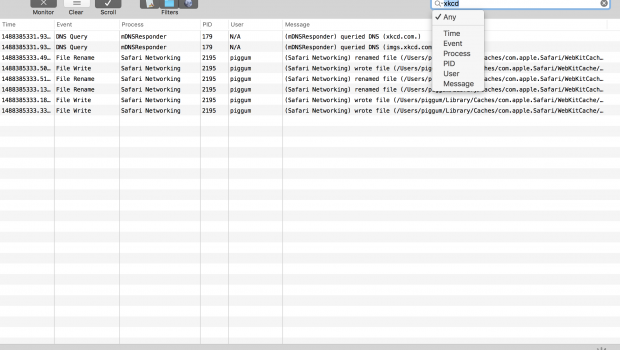
As an example, perhaps we were interested in seeing any processes
that communicated with xkcd.com. We can simply use an “Any” filter and
enter xkcd into the search bar, as seen in Figure 1.
Figure 1: Monitor.app User Interface
We think you will be surprised how useful Monitor can be when trying
to figure out how components of macOS or even malware work under the
hood, all without firing up a debugger or D script.
Click here
to download Monitor.app. Please send any feature requests/bugs to monitorapp-bugs@fireeye.com.
Apple, Mac and MacOS are registered trademarks or trademarks of
Apple Inc.


Gloss