Focus On The Most Resilient Equity Sectors – Biotech And Technology
I wrote in my previous article, "Going Long Both U.S. Equities And Precious Metals," on 11 April that an unprecedented swelling in the Federal Reserve's balance sheet should propel US equities and precious metals such as gold and silver higher.
The premise was straightforward - that US equities and precious metals have historically shown a strong positive correlation with the size of the Fed's balance sheet. This time should be no different, despite the magnitude of the challenge posed by the coronavirus on the global economy.
The Fed's unrivalled ability to control money supply, unrestrained powers to discretionarily expand its mandate, and mammoth commitment to stabilise the financial markets should see financial assets appreciate in value.
Since the end of March, I have recommended several long positions in US equities and silver to subscribers of my Marketplace service The Naked Charts. As seen from the table below detailing the live trades, the iShares Silver Trust ETF (SLV) has returned close to +23%, and Visa (V) has returned +20%. Despite being outnumbered, the winners have more than covered the losers.
Table of live trades for my Marketplace service

Fast forward to May, when the global economy is on the brink of reopening its doors after being wrecked by the coronavirus. The risk of another wave of the virus emerging remains, but new risks have been introduced. There is rising social unrest in the US following the unfortunate death of George Floyd, which throws into question the economy's ability to recover swiftly from the virus as well as Trump's re-election chances.
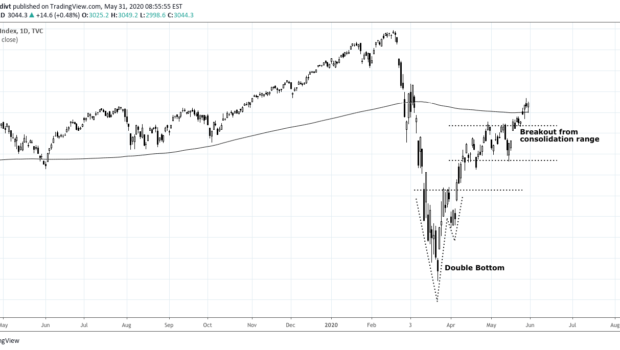
Regular readers will know that I focus on technical charts and price action to gauge where the market is heading, and not fundamentals. The most hardened fundamental analysts will struggle to explain why equities have rallied since March despite the economy in dire straits.
Looking at the daily chart of the S&P 500, it is my analysis that the index made a double bottom in April after it breached the neckline of 2,625. Following that, the index broke out higher from a consolidation range after it breached 2,935 in May. Regardless of the newswires, there is a structure for traders to trade the index. For now, the index remains bullish. If it breaks down back below 2,935, then that would be a red flag for me.
Daily Chart: S&P 500 (SPY)

Within US equities, there are sectors that are better positioned to deal with today's macro backdrop than others. My top two favourites are the biotech and technology sectors.
Daily Chart: SPDR Biotech ETF (XBI)

If you think stocks are languishing below their highs in February before the coronavirus-induced meltdown, think again. Biotech stocks have more than recaptured their February highs; they have gone on to make new all-time highs, breaking higher above the previous highs in 2018. This may be reflective of the expected increase in earnings for biotech companies following the coronavirus saga, where there will be increased testing, analysis, and demand for such products going forward. Regardless, biotech stocks are on my radar simply because they are displaying a high degree of strength relative to the broad market.
If you think you are buying biotech stocks at the high, there is still room for the ratio of XBI/SPY to rise before it reaches its all-time high in 2015. I have drawn the key neckline on the chart below. If this level is cleared, there is a good chance XBI will continue to outperform SPY going forward.
Chart of XBI/SPY

The second sector I have my eye on is the technology sector. Technology stocks have unsurprisingly performed well due to the flexibility and resilience of their business models. The workforce of technology companies are able to carry out their daily operations from home more seamlessly than companies from other sectors, and the coronavirus-aided shift in consumption patterns from brick-and-mortar outlets to online platforms have also benefited the sector. These behavioural patterns may be part of the new normal going forward.
Daily Chart: Technology Select Sector SPDR ETF (XLK)

The Technology Select Sector SPDR ETF is only about 5% away from its all-time high, which is testament to the market's expectation for the sector to adapt to the new normal. Even if protests in the US grow in ferocity and are out of control, the technology sector should be more shielded from this violence and damage vis-a-vis brick-and-mortar stores.
Chart of XLK/SPY

Surprisingly, the ratio of XLK/SPY is not at the all-time highs. The ratio has taken a dip of late, which should be a mere blip in its multi-year uptrend. This analysis has led me to recommend a high concentration of technology stocks in my Marketplace service.
At the end of the day, my argument is that it is difficult to fight the central bank, which has complete control over the supply of money in the economy. Historically, money supply expansion has led to price appreciation in financial assets, such as equities. This time should be no different, especially when the size of the Fed balance sheet is at unprecedented highs. Within equities, biotech and technology stocks will give the most bang-for-buck for your investments.
Since launching in June 2019, my technical analysis service has generated an absolute return of 93.6% with 43 trade recommendations as of May 2020, including live trades. Do check out my Marketplace Service at The Naked Charts!
Disclosure: I am/we are long MSFT, AEM, KR, DLR, SLV, BABA, V. I wrote this article myself, and it expresses my own opinions. I am not receiving compensation for it (other than from Seeking Alpha). I have no business relationship with any company whose stock is mentioned in this article.


Gloss