FLARE Script Series: Automating Obfuscated String Decoding
https://www.ispeech.org/text.to.speech
Introduction
We are expanding our script series beyond IDA Pro. This post extends
the FireEye Labs Advanced Reverse Engineering (FLARE) script series to
an invaluable tool for the reverse engineer – the debugger. Just like
IDA Pro, debuggers have scripting interfaces. For example, OllyDbg
uses an asm-like scripting language, the Immunity debugger contains a
Python interface, and Windbg has its own language. Each of these
options isn’t ideal for rapidly creating string decoding debugger
scripts. Both Immunity and OllyDbg only support 32-bit applications,
and Windbg’s scripting language is specific to Windbg and, therefore,
not as well-known. The pykd project was created to
interface between Python and Windbg to allow debugger scripts to be
written in Python. Because malware reverse engineers love Python, we
built our debugger scripting library on top of pykd for Windbg.
Here we release a library we call flare-dbg. This library provides several utility
classes and functions to rapidly develop scripts to automate debugging
tasks within Windbg. Stay tuned for future blog posts that will
describe additional uses for debugger scripts!
String Decoding
Malware authors like to hide the intent of their software by
obfuscating their strings. Quickly deobfuscating strings allows you to
quickly figure out what the malware is doing.
As stated in Practical Malware Analysis, there are generally two
approaches to deobfuscating strings: self-decoding and manual
programming. The self-decoding approach allows the malware to
decode its own strings. Manual programming requires the reverse
engineer to reprogram the decoding function logic. A subset of the
self-decoding approach is emulation, where each assembly
instruction execution is emulated. Unfortunately, library call
emulation is required, and emulating every library call is difficult
and may cause inaccurate results. In contrast, a debugger is attached
to the actual running process, so all the library functions can be run
without issue. Each of these approaches has their place, but this post
teaches a way to use debugger scripting to automatically self-decode
all obfuscated strings.
Challenge
To decode all obfsucated strings, we need to find the following: the
string decoder function, each time it is called, and all arguments to
each of those instances. We then need to run the function and read out
the result. The challenge is to do this in a semi-automated way.
Approach
The first task is to find the string decoder function and get a
basic understanding of the inputs and outputs of the function. The
next task is to identify each time the string decoder function is
called and all of the arguments to each call. Without using IDA, a
handy Python project for binary analysis is Vivisect. Vivisect
contains several heuristics for identifying functions and
cross-references. Additionally, Vivisect can emulate and disassemble a
series of opcodes, which can help us identify function arguments. If
you haven’t already, be sure to check out the FLARE scripting series
post on tracking function arguments using emulation,
which also uses Vivisect.
Introducing flare-dbg
The FLARE team is introducing a Python project, flare-dbg that runs on top of pykd. Its goal is to
make Windbg scripting easy. The heart of the flare-dbg project lies in the DebugUtils class, which contains several functions
to handle:
· Memory and register manipulation
· Stack
operations
· Debugger execution
·
Breakpoints
· Function calling
In addition to the basic debugger utility functions, the DebugUtils class uses Vivisect to handle the
binary analysis portion.
Example
I wrote a simple piece of malware that hides strings by encoding
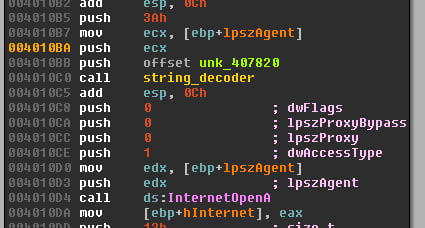
them. Figure 1 shows an HTTP User-Agent string being decoded by a
function I named string_decoder.
Figure 1: String decoder function reference in
IDA Pro
After a cursory look at the string_decoder function, the arguments
are identified as an offset to an encoded string of bytes, an output
address, and a length. The function can be described as the following
C prototype:

Now that we have a basic understanding of
the string_decoder function, we test decoding using Windbg and
flare-dbg. We begin by starting the process with Windbg and executing
until the program’s entry point. Next, we start a Python interactive
shell within Windbg using pykd and import flaredbg.

Next, we create a DebugUtils object, which
contains the functions we need to control the debugger.

We then allocate 0x3A-bytes of memory for the output string. We use
the newly allocated memory as the second parameter and setup the
remainder of the arguments.

Finally, we call the string_decoder function at virtual address
0x401000, and read the output string buffer.

After proving we can decode a string with flare-dbg, let’s automate all calls to the string_decoder function. An example debugger
script is shown in Figure 2. The full script is available in the
examples directory in the github repository.

Figure 2. Example basic debugger script
Let’s break this script down. First, we identify the function
virtual address of the string decoder function and create a DebugUtils object. Next, we use the DebugUtils function get_call_list to find the three push arguments for
each time string_decoder is called.
Once the call_list is generated, we
iterate all calling addresses and associated arguments. In this
example, the output string is decoded to the stack. Because we are
only executing the string decoder function and won’t have the same
stack setup as the malware, we must allocate memory for the output
string. We use the third parameter, the length, to specify the size of
the memory allocation. Once we allocate memory for the output string,
we set the newly allocated memory address as the second parameter to
receive the output bytes.
Finally, we run the string_decoder
function by using the DebugUtils call function and read the result from
our allocated buffer. The call function sets up the stack, sets any
specified register values, and executes the function. Once all strings
are decoded, the final step is to get these strings back into our
IDB. The utils script contains utility
functions to create IDA Python scripts. In this case, we output an IDA
Python script that creates comments in the IDB.
Running this debugger script produces the following output:

The output IDA Python script creates repeatable comments on all
encoded string locations, as shown in Figure 3.

Figure 3. Decoded string as comment
Conclusion
Stay tuned for another debugger scripting series post that will
focus on plugins! For now, head over to the flare-dbg github
project page to get started. The project requires pykd,winappdbg, and vivisect.


Gloss