
Align Technology: Potential Downswing Should Be Short-Lived (NASDAQ:ALGN)
Asia-Pacific Images Studio/E+ via Getty Images
If we look at the long-term chart of Align Technology, Inc. (ALGN) (orthodontics player), we can see that shares have enjoyed a blistering rally over the past two decades. In saying this, the MACD technical indicator has never been as overbought as it is at present on the long-term chart. Furthermore, a crossover has now taken place which is, in fact, a sell signal, and investors should take note of the height of this sell signal which brings more bearish connotations to ALGN at present. We like to use this technical indicator on long-term charts due to the duality of the indicator (trend and momentum) as well as the sheer amount of information involved in the reading.
MACD crossover in ALGN (Stockcharts)
On a more short-term chart, we see the ramifications of that MACD monthly crossover alluded to above. Shares of ALGN have now dropped below their 200-month average, and the corresponding 100-month average has also turned down rather aggressively. Furthermore, volume trends continue to be bearish despite the rally shares have undergone in February.
Bearish technicals in ALGN (Stockcharts)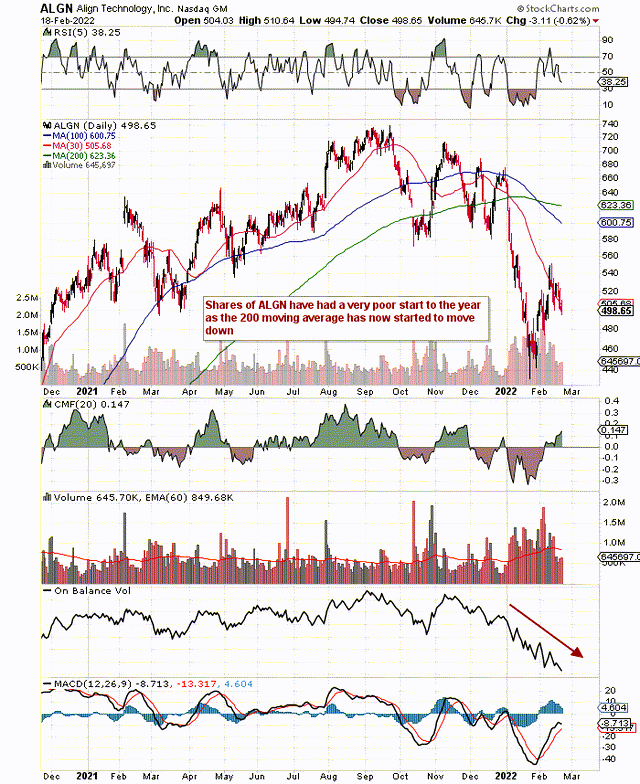
In order to ascertain the potential downside in ALGN, we like to go to balance sheet trends to get a solid read on the financial condition of the company. If some of the company's key line items are improving, it would definitely stack the odds in favor of only a quick decline as long as the valuation is not over-extended. We will start off with ALGN's cash and cash equivalents and study a period of the past 10 quarters.
Align's cash & short-term investments came in at $1.17 billion at the end of Q4. This means this line-item has increased by approximately 62% over the past 10 quarters. On the whole, we like seeing rising cash numbers in companies as it gives the company in question more options with respect to undergoing stock buybacks for example. The current share buyback program, for example, has $725 million remaining on it. Shares outstanding at present (21st of February 2022) amounted to 78.85 million, which is down around 1.1 million compared to Q2 in 2019.
The other principal current asset is receivables which came in at $897 million at the end of Q4 which we see below. Here, we have seen a 48% increase over the past 10 quarters. Current assets, therefore, came in at $2.49 billion whereas current liabilities came in at $1.924 billion. Growth in current liabilities has outpaced current assets in this time frame (143%). To this effect, the company's current ratio came in at 1.3 in Q4, which means liquidity has decreased pretty significantly over the past 10 quarters (the current ratio came in at 2.9 in Q2-2019).
Balance sheet info on ALGN (Earnings Presentation)
Although the current ratio is a measure of the company's ability to pay off its short-term debts over the next year, Align definitely has some margin here due to its sizable cash flows. In Q4 alone, for example, the company generated almost $273 million of operating cash flow, of which $109 million was deployed towards CAPEX spend (capacity & facilities). Suffice it to say, long-term assets have undoubtedly been increasing as we will see in the next section.
The main long-term asset is Align's Net property, Plant & Equipment, which increased to over $1.2 billion at the end of Q4. The close to 100% increase here in this line item since Q2-2019 demonstrates how management has been investing heavily back into the business. Furthermore, one cannot say that this aggressive re-investment is not producing the desired results. Top-line sales over the past 10 quarters have risen by over $430 million or 43% to come in presently at $1.031 billion at the end of the most recent fourth quarter. This is a solid return especially when one takes into account that there always is a time gap between sustained re-investment and sales growth to follow on the income statement.
The lack of debt on the balance sheet means that the company can continue to invest aggressively and still report decent profits. Although Align's GAAP operating margin dropped to 21.4% in the fourth quarter, the company still reported $191 million in net profit. This really is the key for Align. As long as present trends continue, sustained revenue and earnings growth simply have to continue due to Align's prowess at generating cash flow in an above-average spending environment.
Shareholder equity rose to $3.62 billion at the end of Q4, which means this line-item has increased by more than 163% over the past 10 quarters. Irrespective of what the share price has done over this time frame, growing net-worth is how management should really be graded. Since liabilities currently come in at $2.31 billion, the current liability to equity ratio comes in at 0.64. The ratio came in at 0.70 10 quarters ago, which is encouraging as it shows we are dealing with sound capital allocators here.
To sum up, trends on the balance sheet are pointing to sustained strong top and bottom-line growth percentages in the years to come. If indeed the technicals do play out and we get a sustained down-move, Align would be a potential strong buy in the months to come. We must though continue to respect Align's technicals; they really are the summation of all known fundamentals to date. We look forward to continued coverage.


Gloss